Learn the Same Smart-Money Logic Used by Hedge Funds & Institutional Traders — From a Proven Practitioner
Master orderflow, market profile, VWAP & footprint trading — built on real institutional logic.
Why BE TAUGHT BY ME PERSONALLY 1:1
If you’re serious about transforming your trading results, The Bankers Club is your gateway to mentorship inspired by the methods used in institutional trading rooms. I will be teaching you methods that will enable you to know and see exactly whats taking place in the markets and how to successfully navigate them
This is not about signal services or generic courses — it’s about building your own consistent edge with the guidance of myself
Who This Is For
-
Aspiring full-time traders ready to scale their results
-
Semi-professionals looking to add institutional structure to their strategy
-
Traders struggling with consistency and discipline
-
Advanced learners ready for market profile, order flow, and time-based confluences
Total beginners
What You WILL GAIN
✅ 1:1 Mentoring Sessions
Tailored 60 minute weekly coaching calls with Benecci focusing on your current challenges and goals, in this we can work together teaching you how to read and use the tools and strategies, identify your weaknesses and create a personal education plan in order for you to totally master the markets and know when , how and why your entering and exiting the market.
✅ Access to BENECCI Proprietary Bankers Club Framework
Including time-window strategies using my charts and secret charts, market profile confluence, and secret algo mapping techniques , You will be taking your trading to a complete new level with what i will be exclusively teaching you and introducing you to.
✅ Ongoing Support & Feedback
Regular check-ins and chat access to keep you on track and evolving
✅ Optional Trade Reviews & Journal Audits
We’ll dissect your trades and help you find where the edge is leaking
✅ EXCLUSIVE ACCESS TO MY LATEST 2026 CHARTS AND INDICAOTRS
My complete upto date calibrated chartbook and indicator studys, including the extra charts and studies not available in the public domain
✅ EXCLUSIVE ACCESS TO MY PERSOANAL AI TRADE ANALYST I DEVELOPED DAILY OVER THE PAST 10 MONTHS
This is special, this software will analyse your chartbook i give you and tell you an indepth analysis of the markets and help you locate and validate area of supply snd demand where institutional algorithmic activity is like to take place, can be used for both intra-day and swing trading setups.
✅ FREE LIFETIME ACCESS TO MY DIScORD
No need to pay ongoing subscription to be in there
Mentoring Topics Include
-
High-Probability Reversal Zones and precision entry techniques you will not see anywhere else
-
Professional Risk & Money Management
-
Trading Psychology at the Pro Level
-
Market Profile & Order Flow Integration, how to use my profile charts like a road map
-
Building and Testing Your Trading Edge
Introducing you to , teaching and providing access to the extra software i use and developed over the past 10 months that will change the way you analyse the markets
1:1 Institutional Mentorship
4 WEEK PROGRAM
- Perfect for those who already has some experience with my charts or strategies and looking to fast track to success
contact for pricing options
8 WEEK PROGRAM
- Perfect for those traders who are neither totally new to these tools and Institutional strategies , or for those who want the extra calls to really elevate their trading
contact for pricing options
3 MONTH PROGRAM
- Completely dominate the markets by working alongside me for a 4 month duration
contact for pricing options
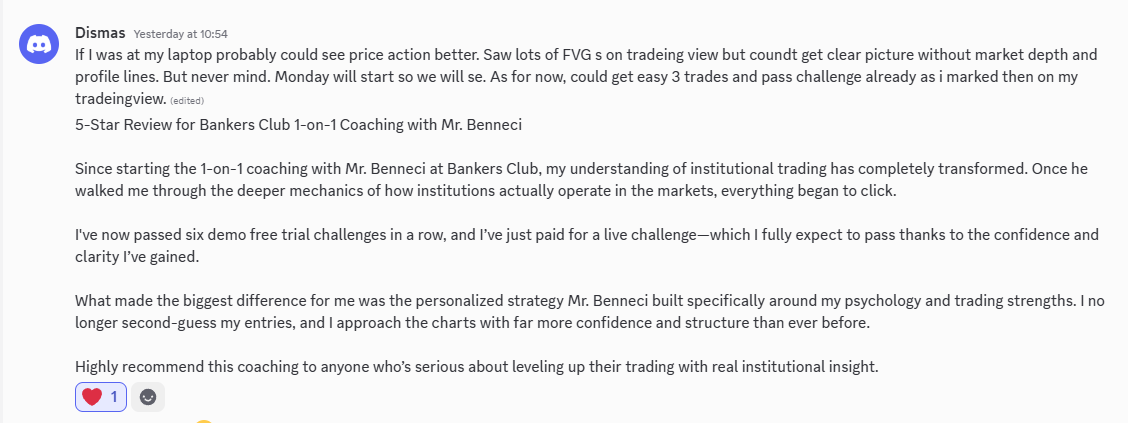
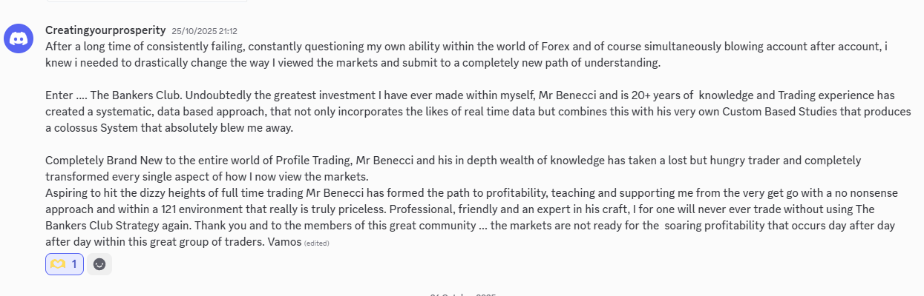
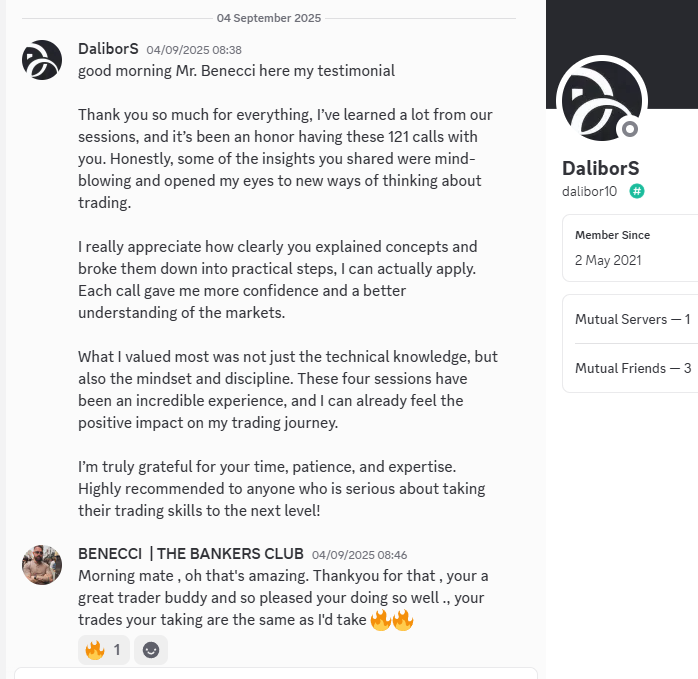
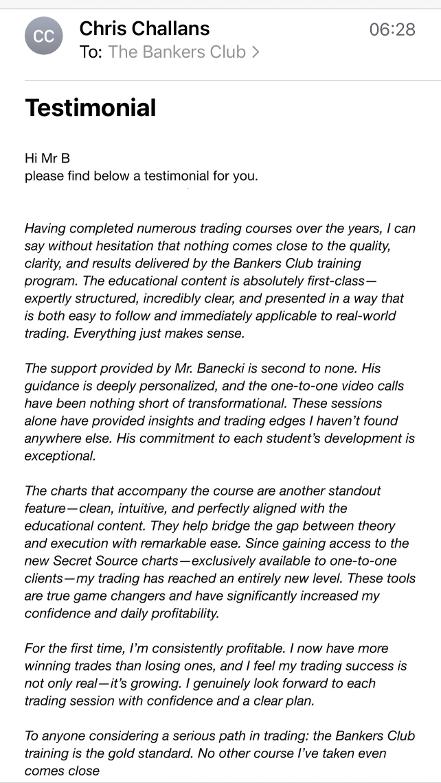
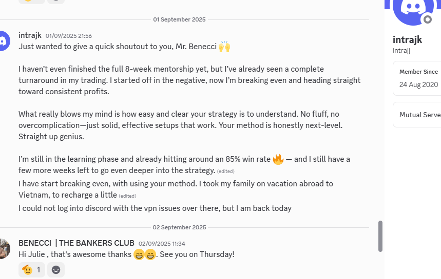
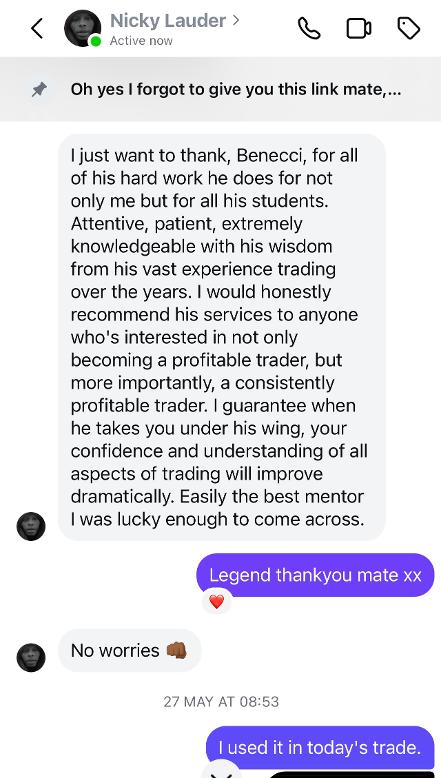
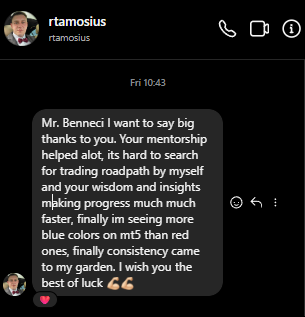
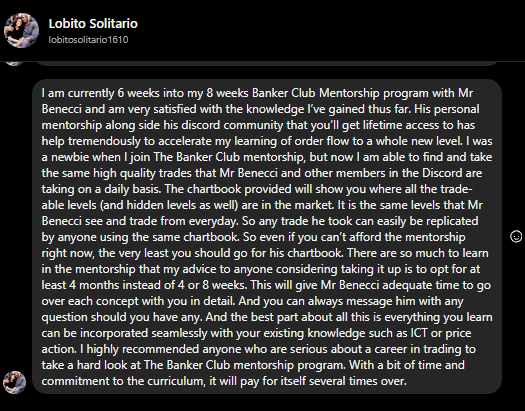
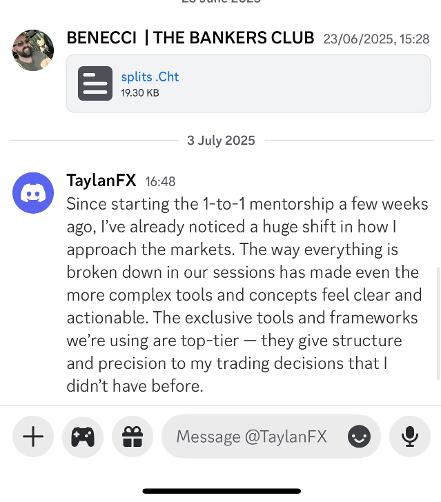
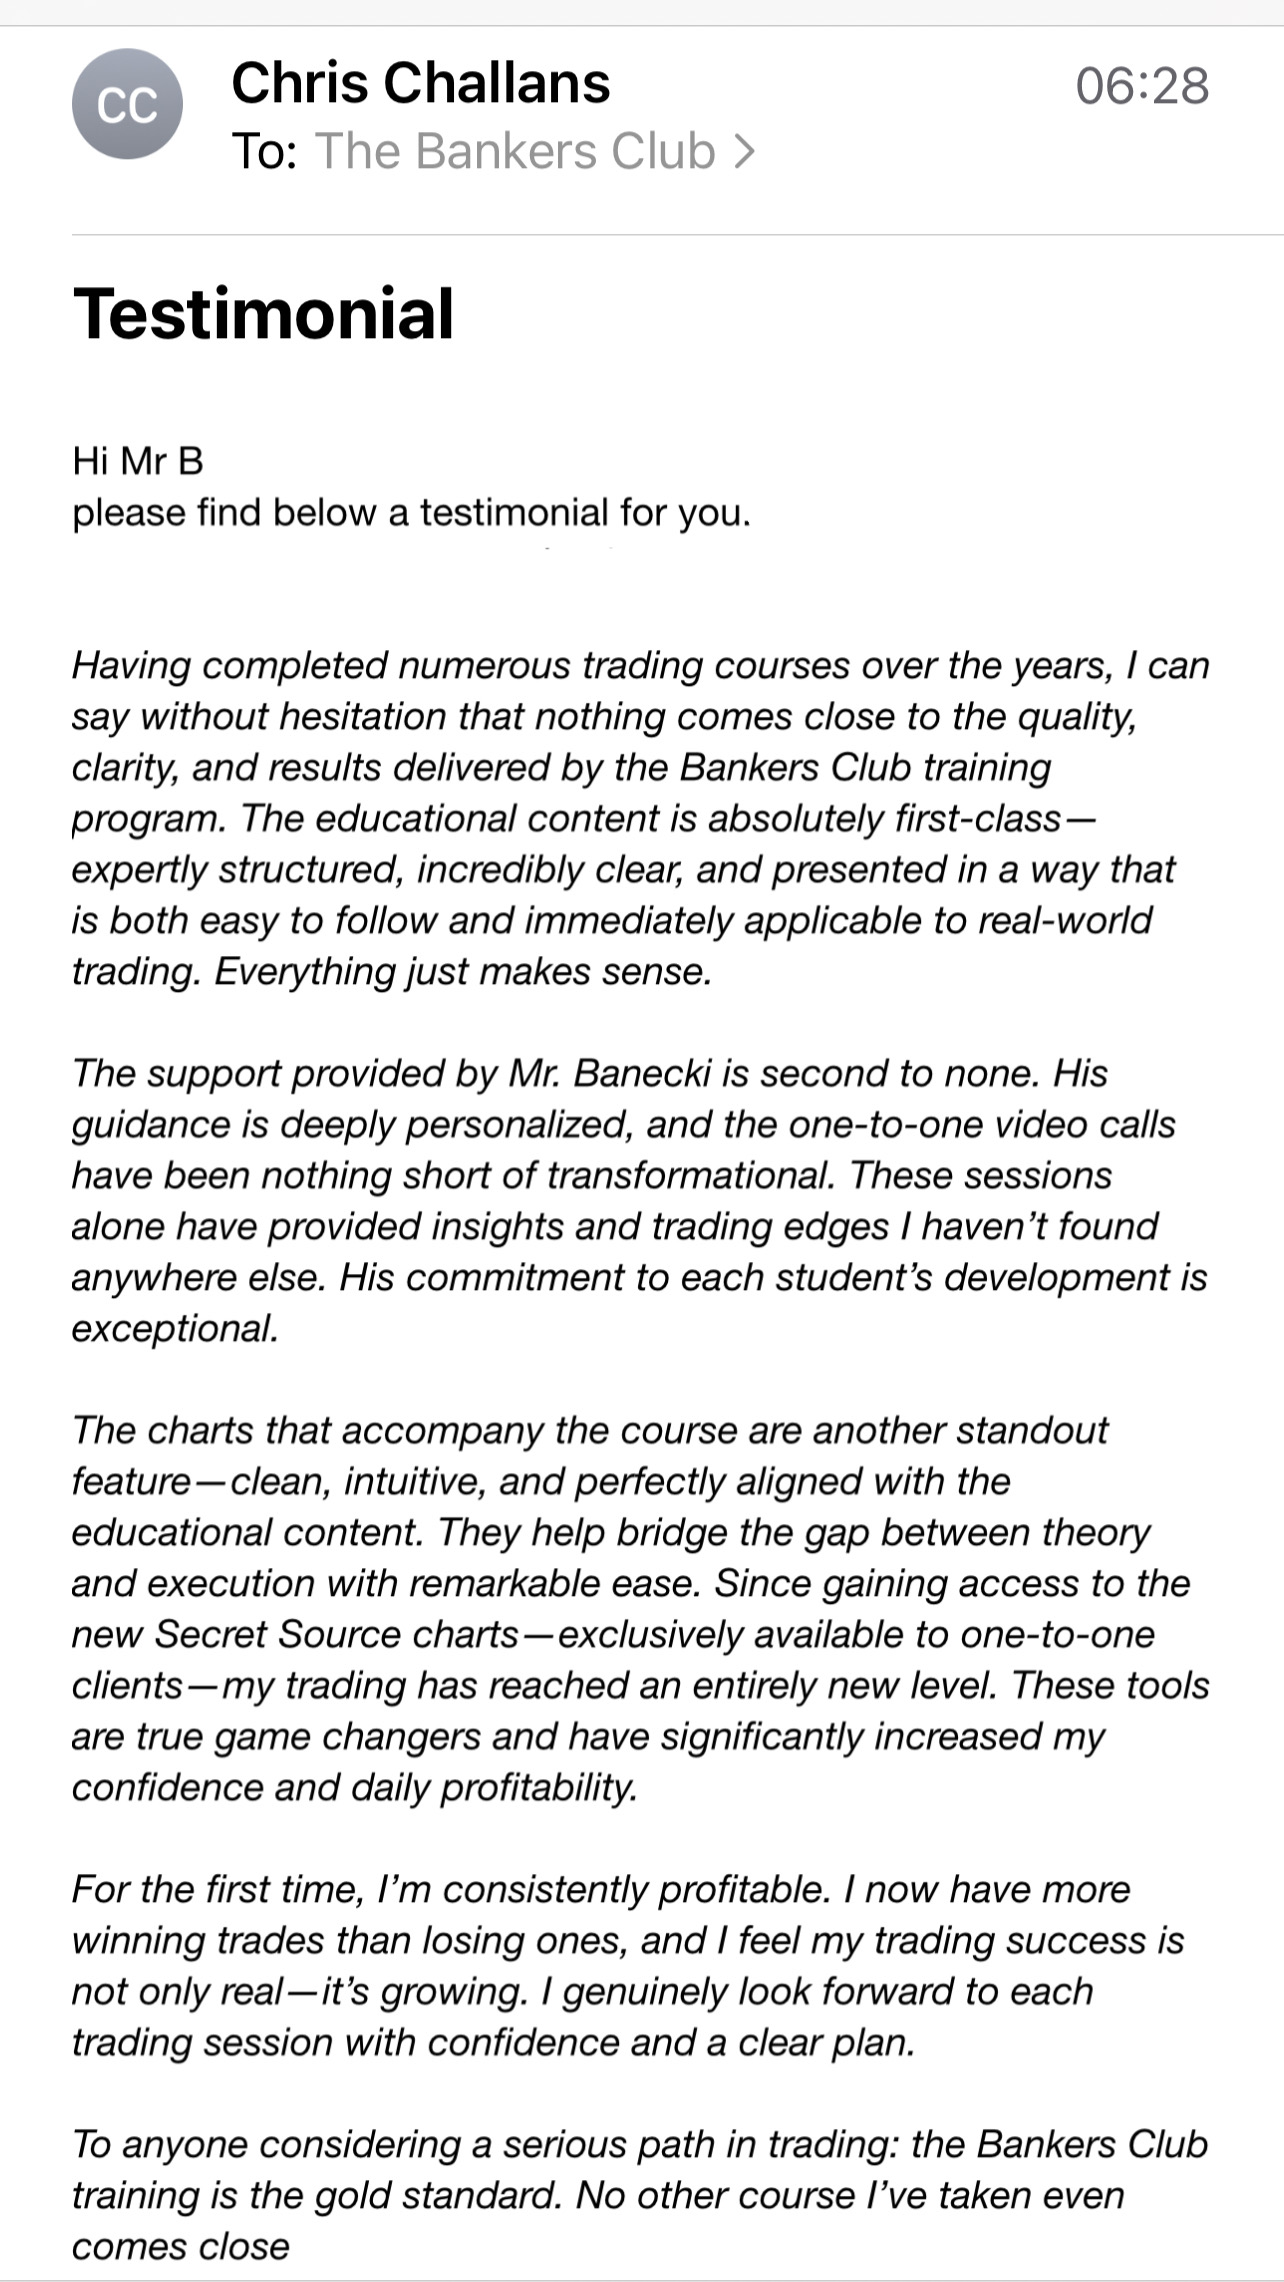
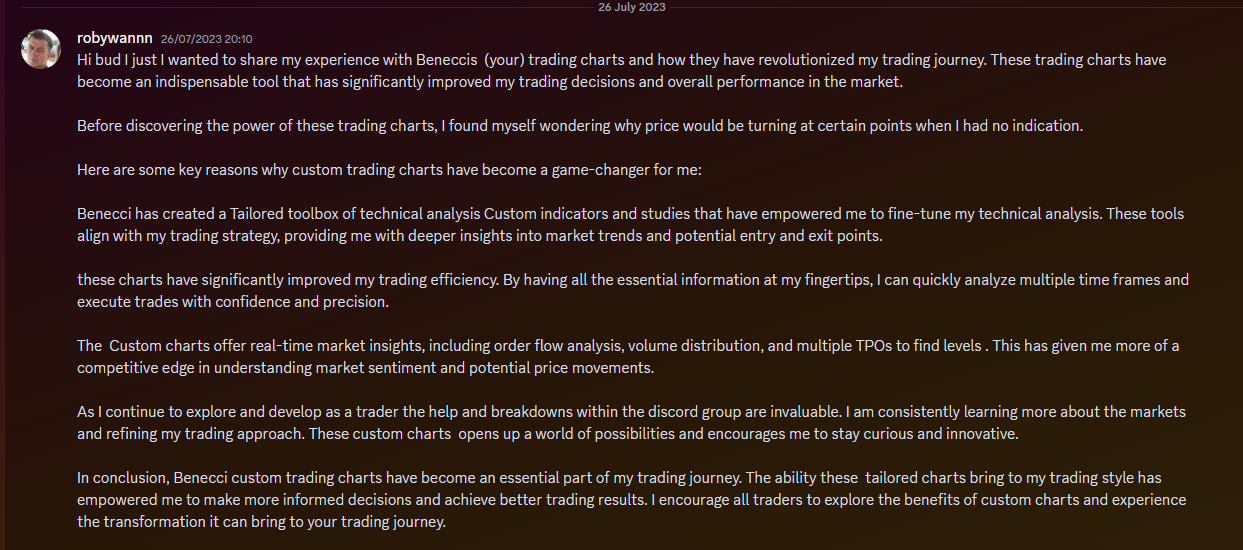
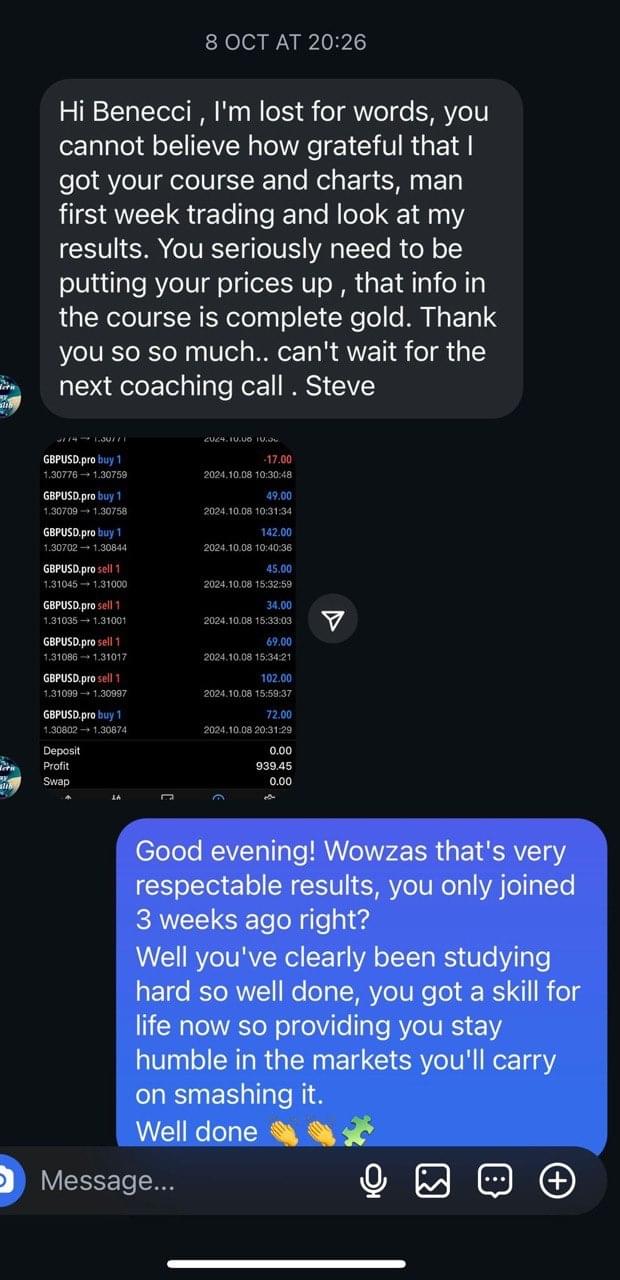
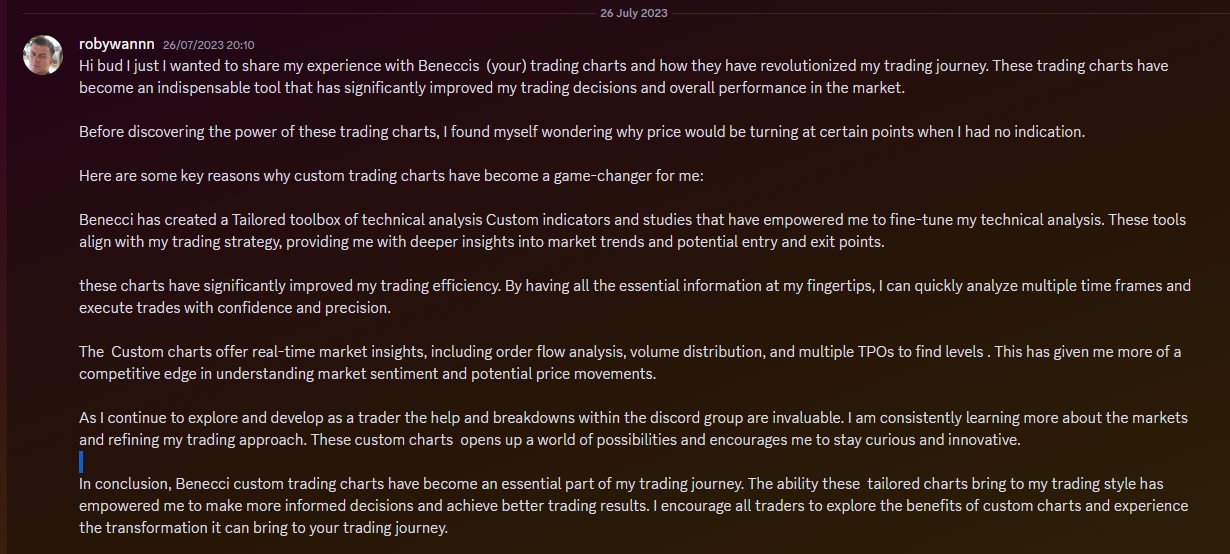
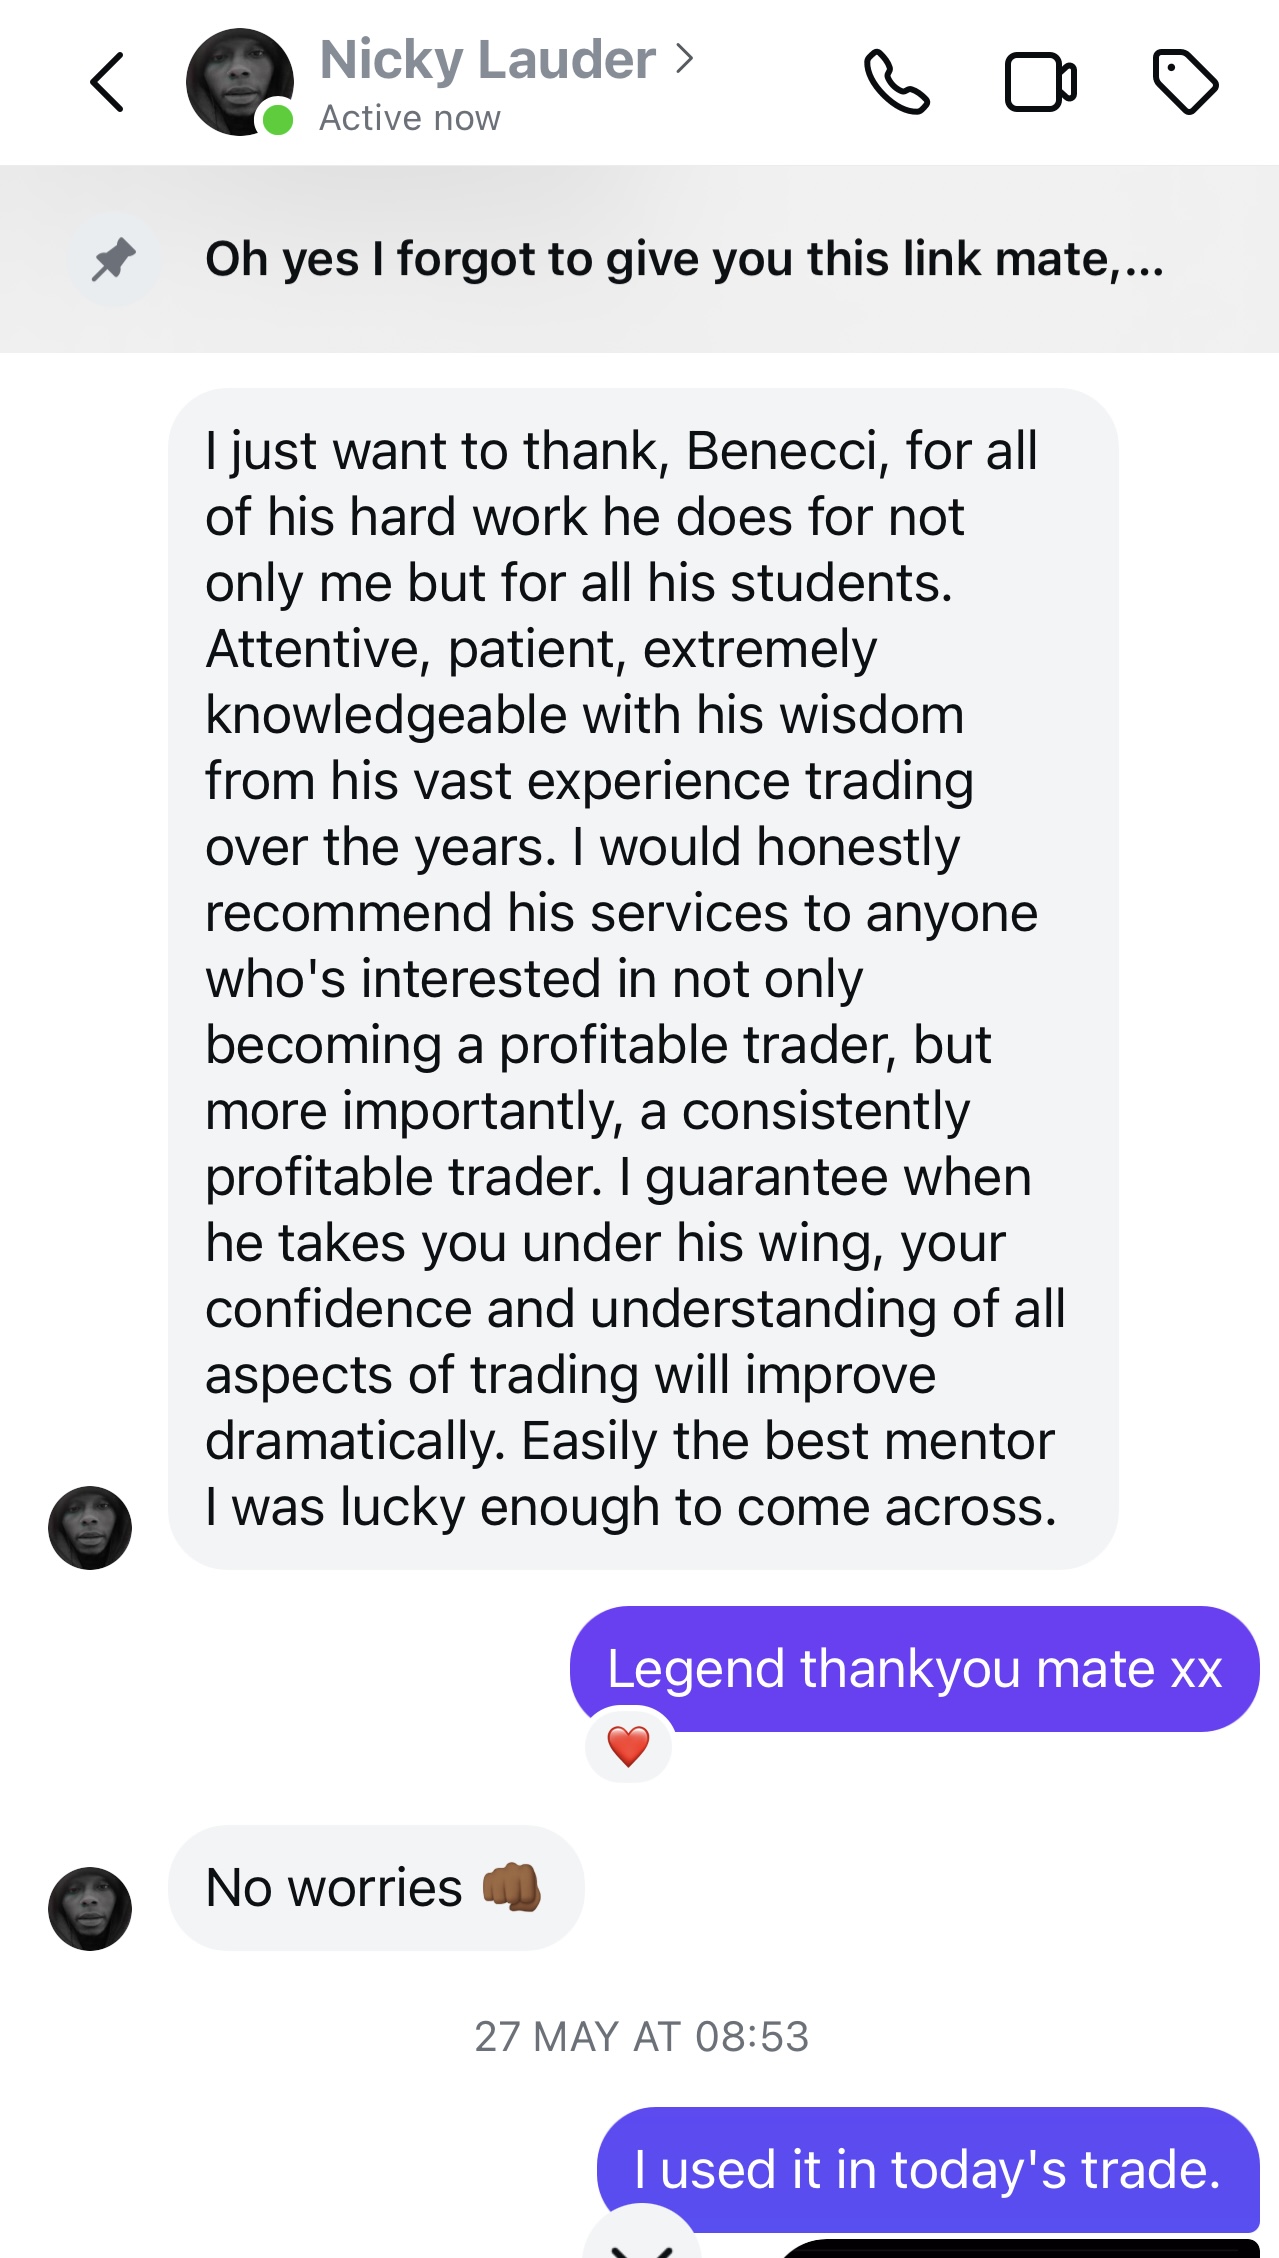
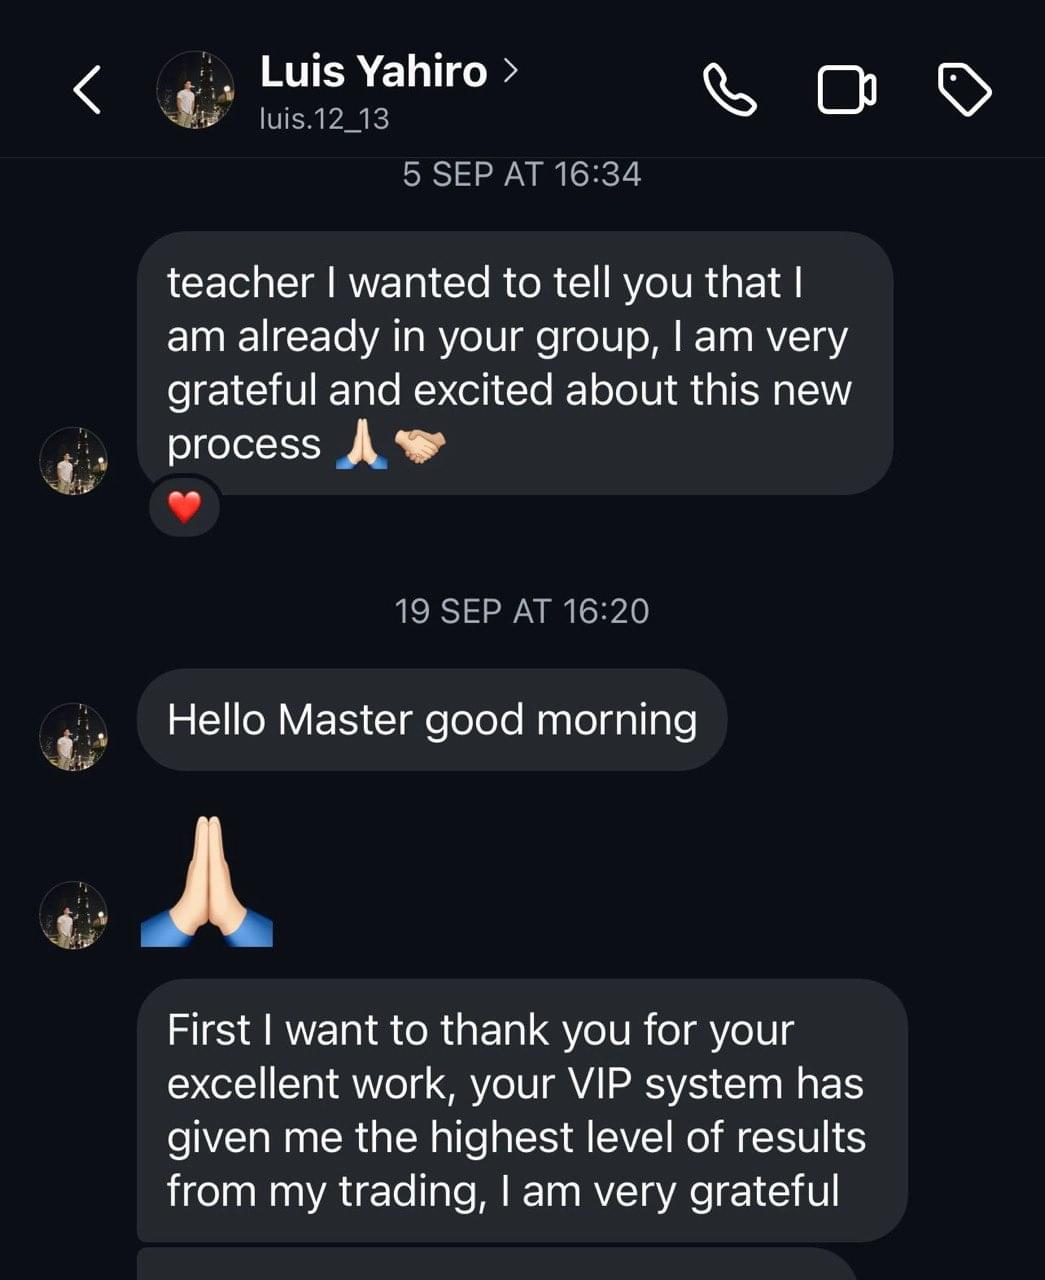
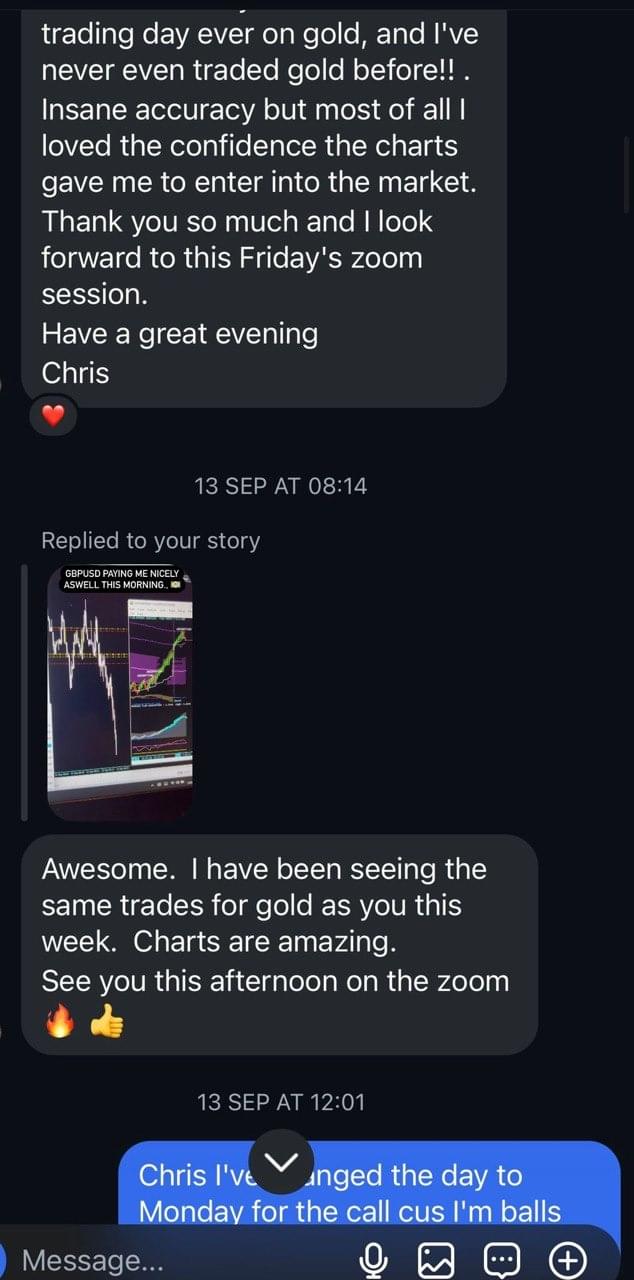
WHAT BENECCI BANKERS CLUB MENTORSHIP ARE SAYING

